
Dashboard Overview
Feature Availability
Available on both Web/Mobile Browser and CircularONE Mobile App.
Introduction
Dashboard provides users with an intuitive, real-time overview of their Product Performance, Hardware Performance, Site Performance. Key components of the dashboard includes Total Production Volume, Hardware Fleet, Sustainability Metrics.
Viewing of Dashboard
After logging into CircularONE, users can access the performance dashboard. Based on the available data, they will be able to view specific metrics related to their partnership’s Site Performance, Product Performance, and Hardware Performance.
To view the Dashboard, you can:
Steps | ||
|---|---|---|
1 | Head to ‘Performance’ under Dashboard Management | |
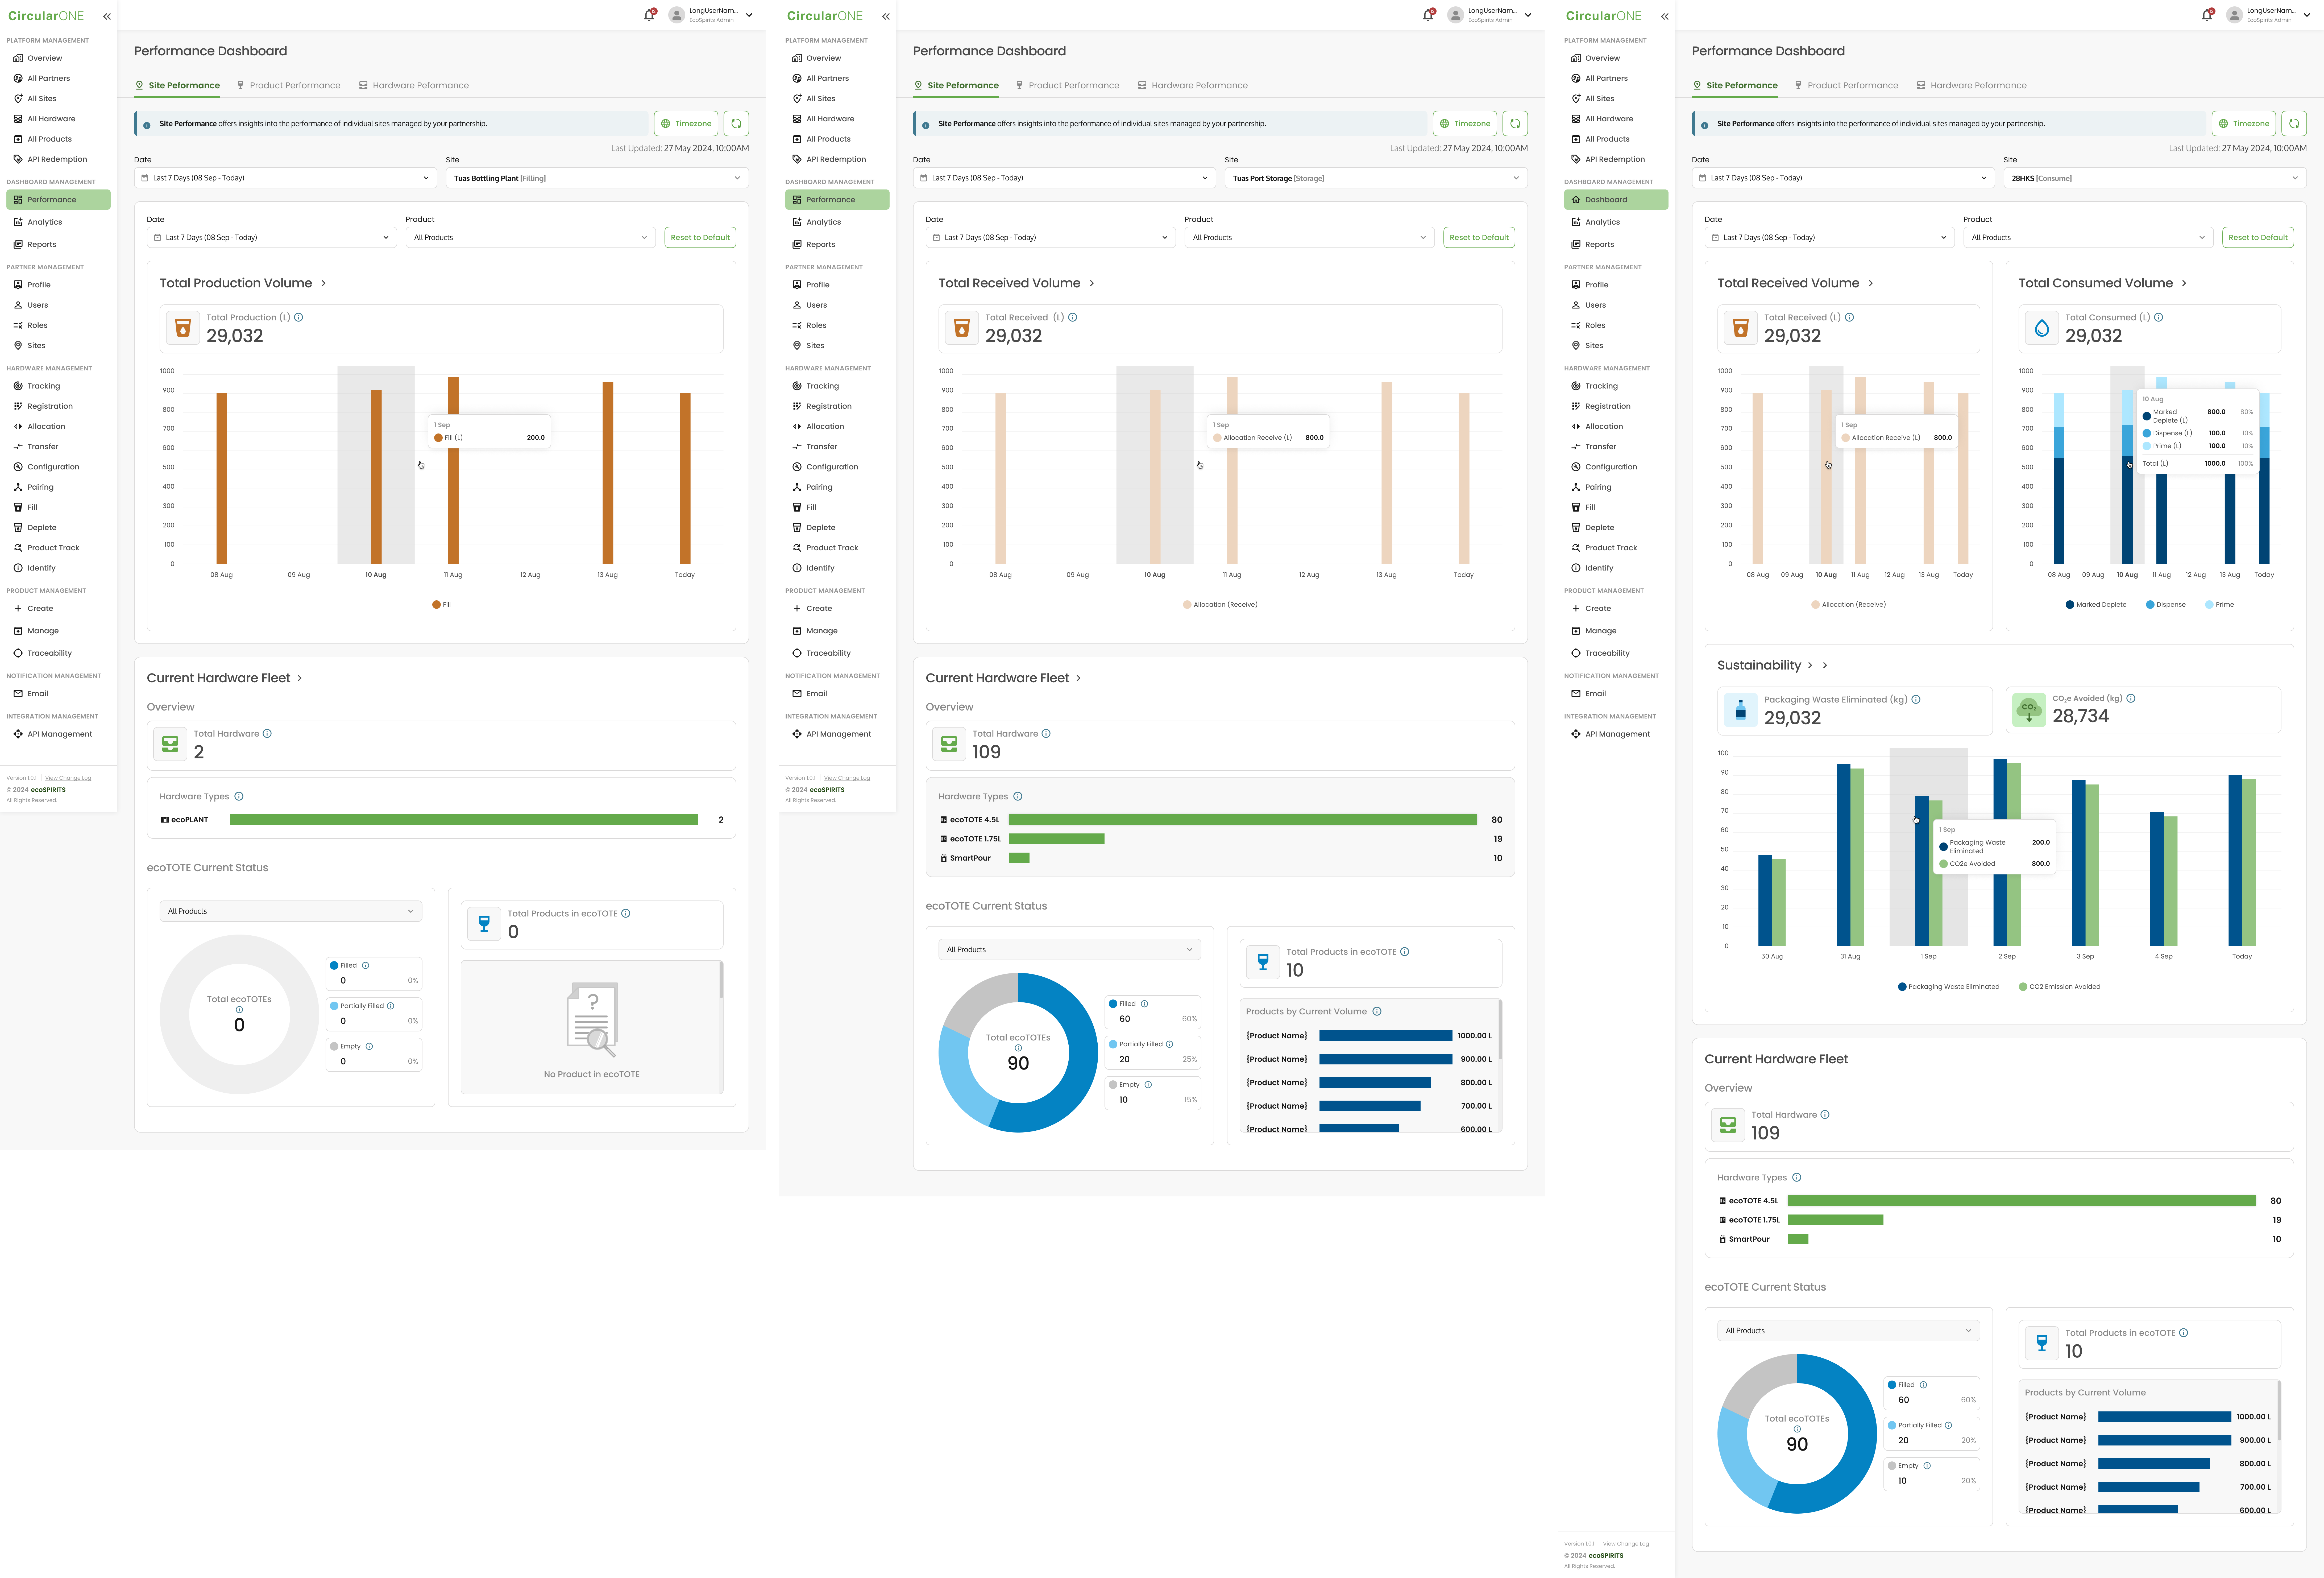
2 | Access the Site Performance Dashboard through the ‘Site Performance’ tab. To view data for a specific date, site, or product, simply apply the relevant available filters to customise your view. | |
| ||
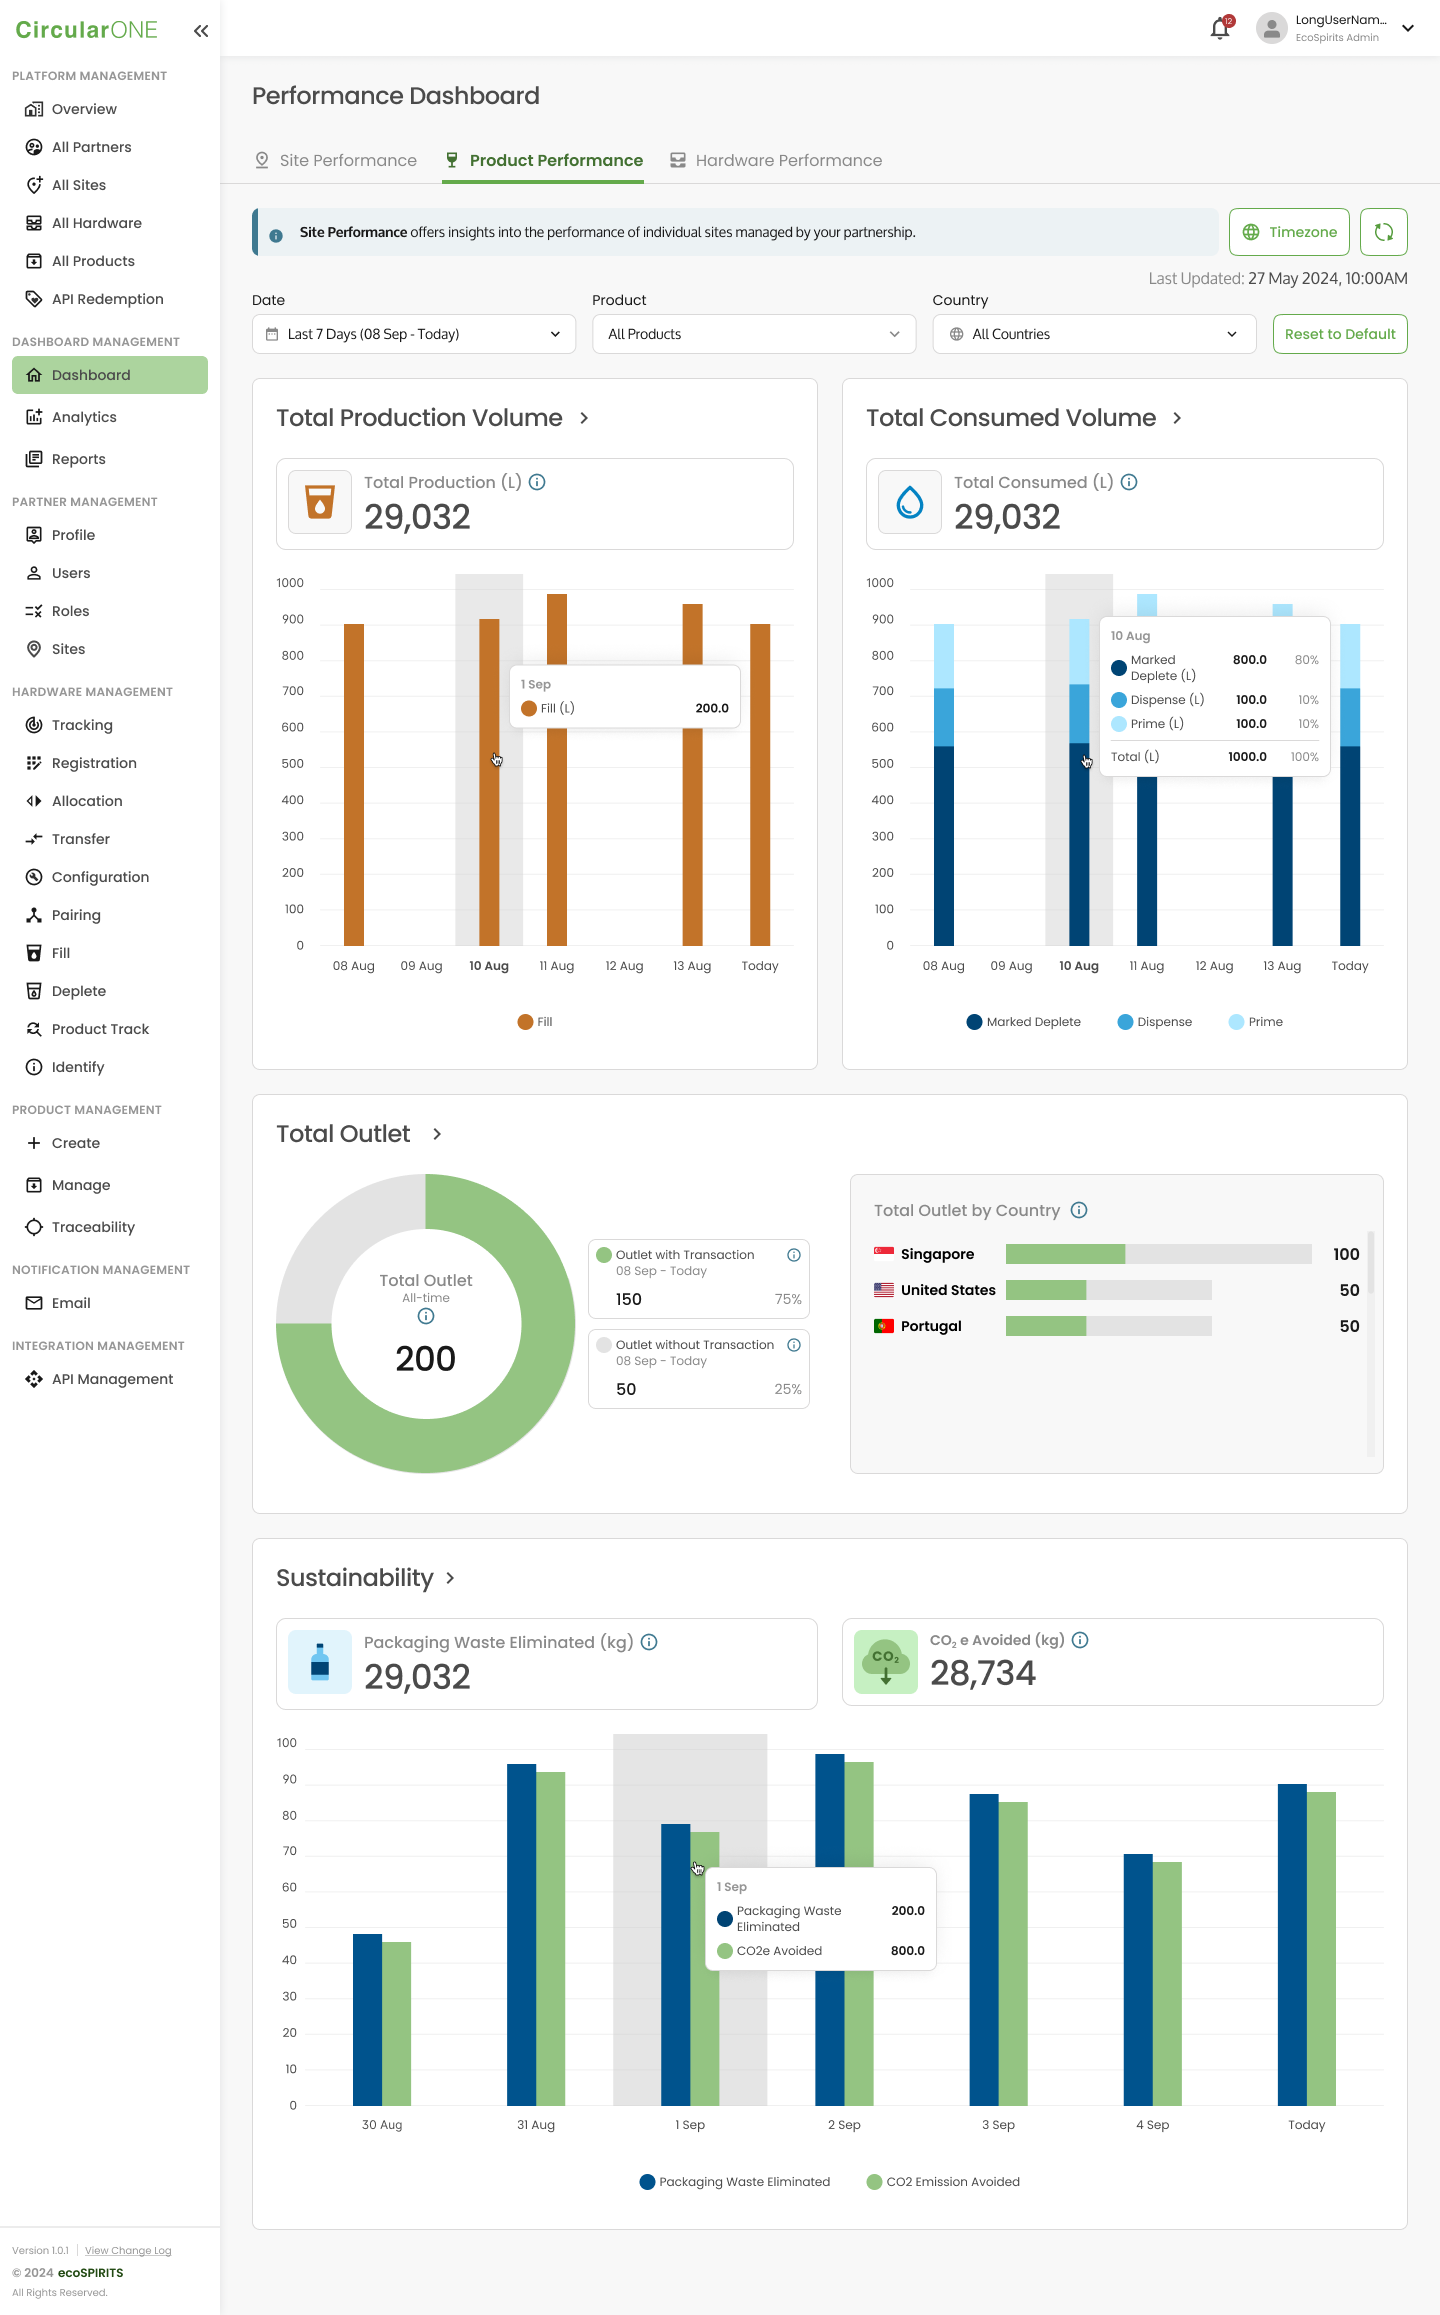
3 | Access the Product Performance Dashboard through the ‘Product Performance’ tab. To view data for a specific date, site, or product, simple apply the relevant available filters to customise your view. | |
| ||
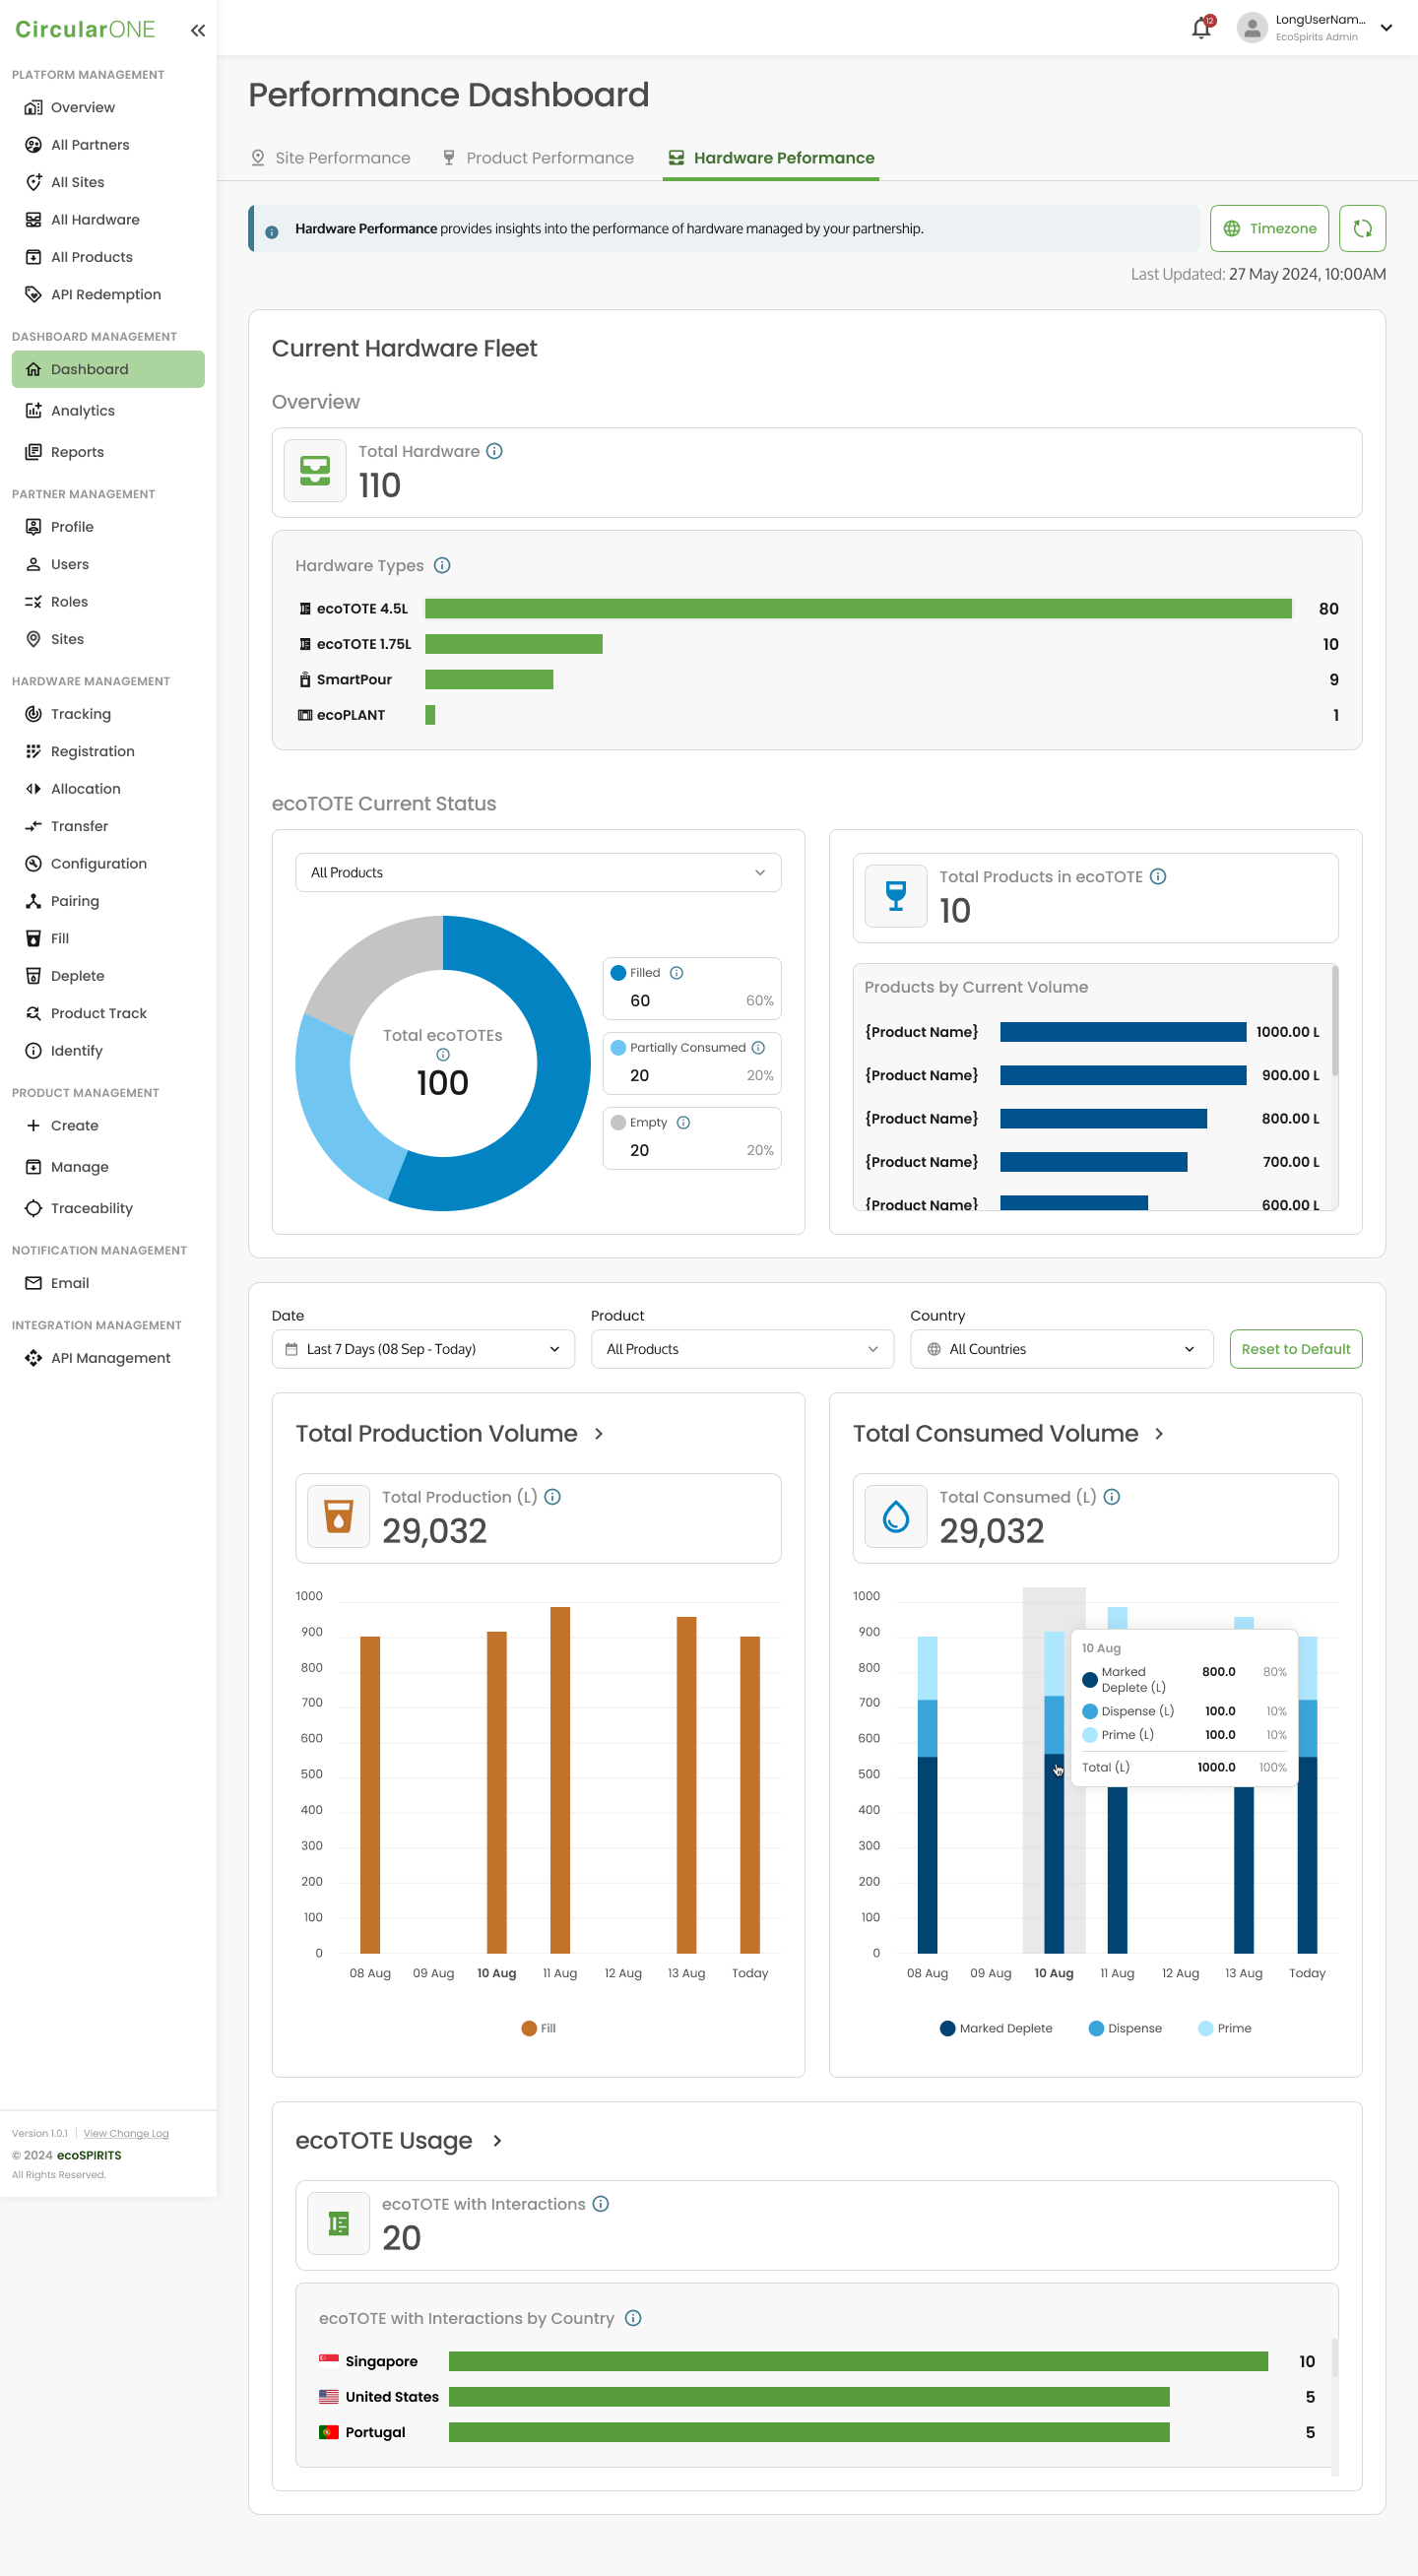
4 | Access the Hardware Performance Dashboard through the ‘Hardware Performance’ tab. To view data for a specific date, site, or product, simply apply the relevant available filters to customise your view. | |
| ||
Period Comparison
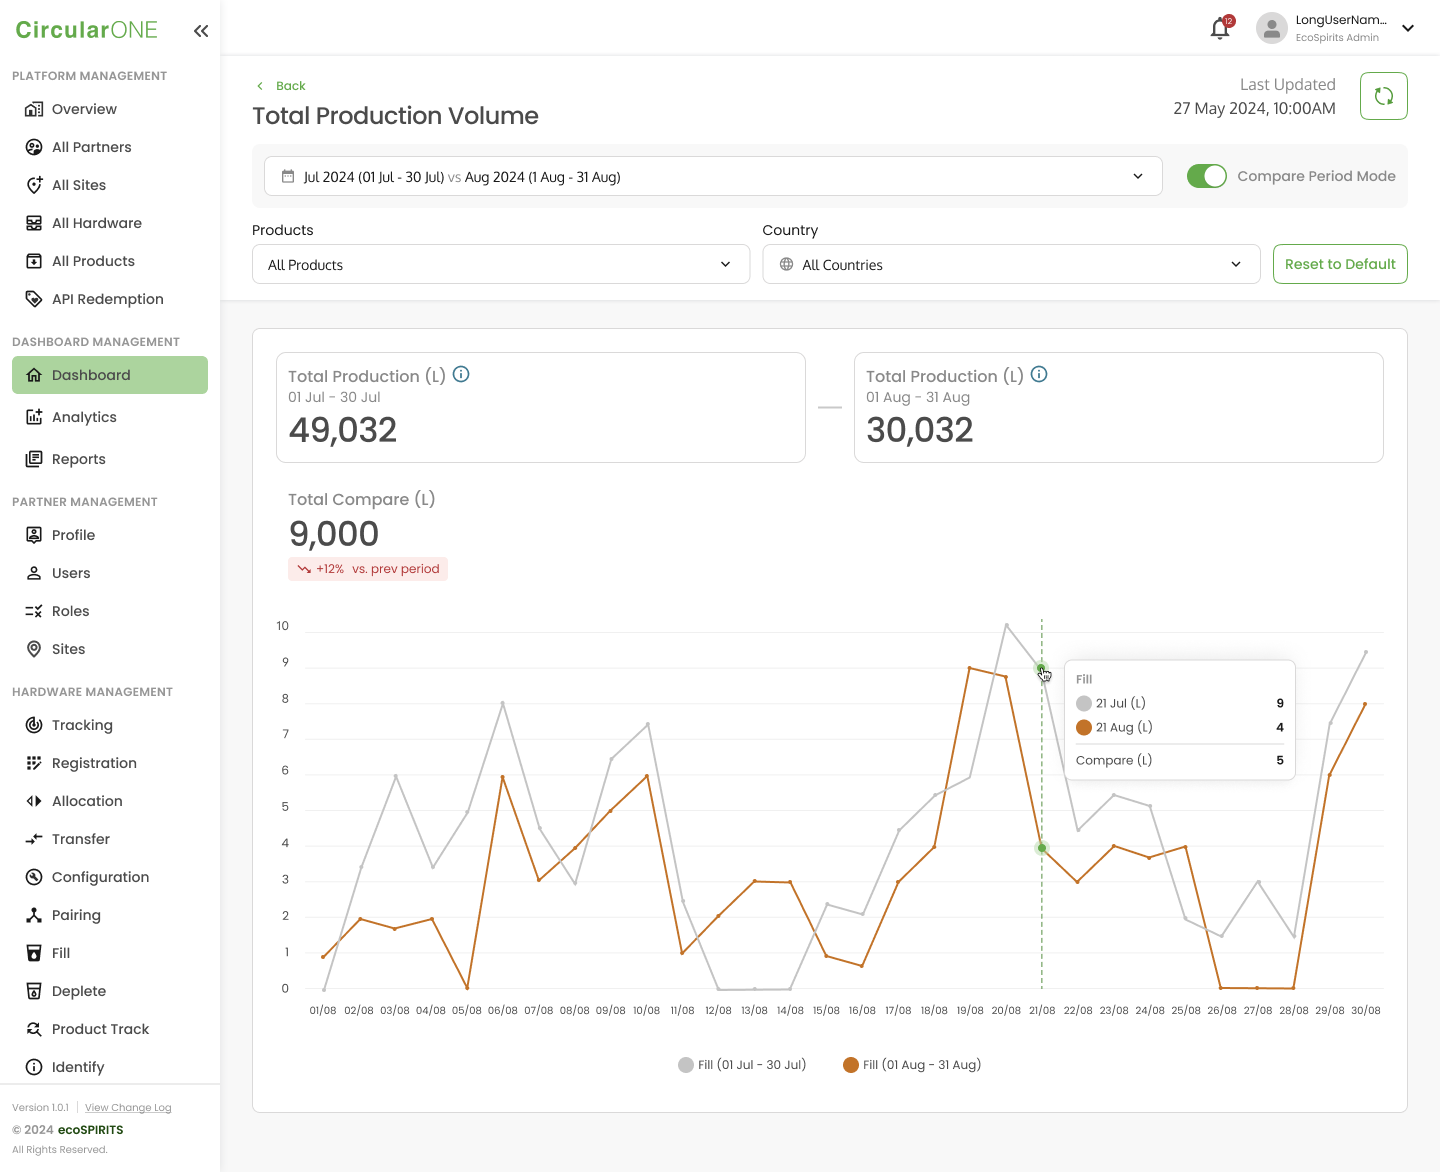
To compare the data across different periods, you can:
Steps | ||
|---|---|---|
1 | Head to ‘Performance’ under Dashboard Management | |
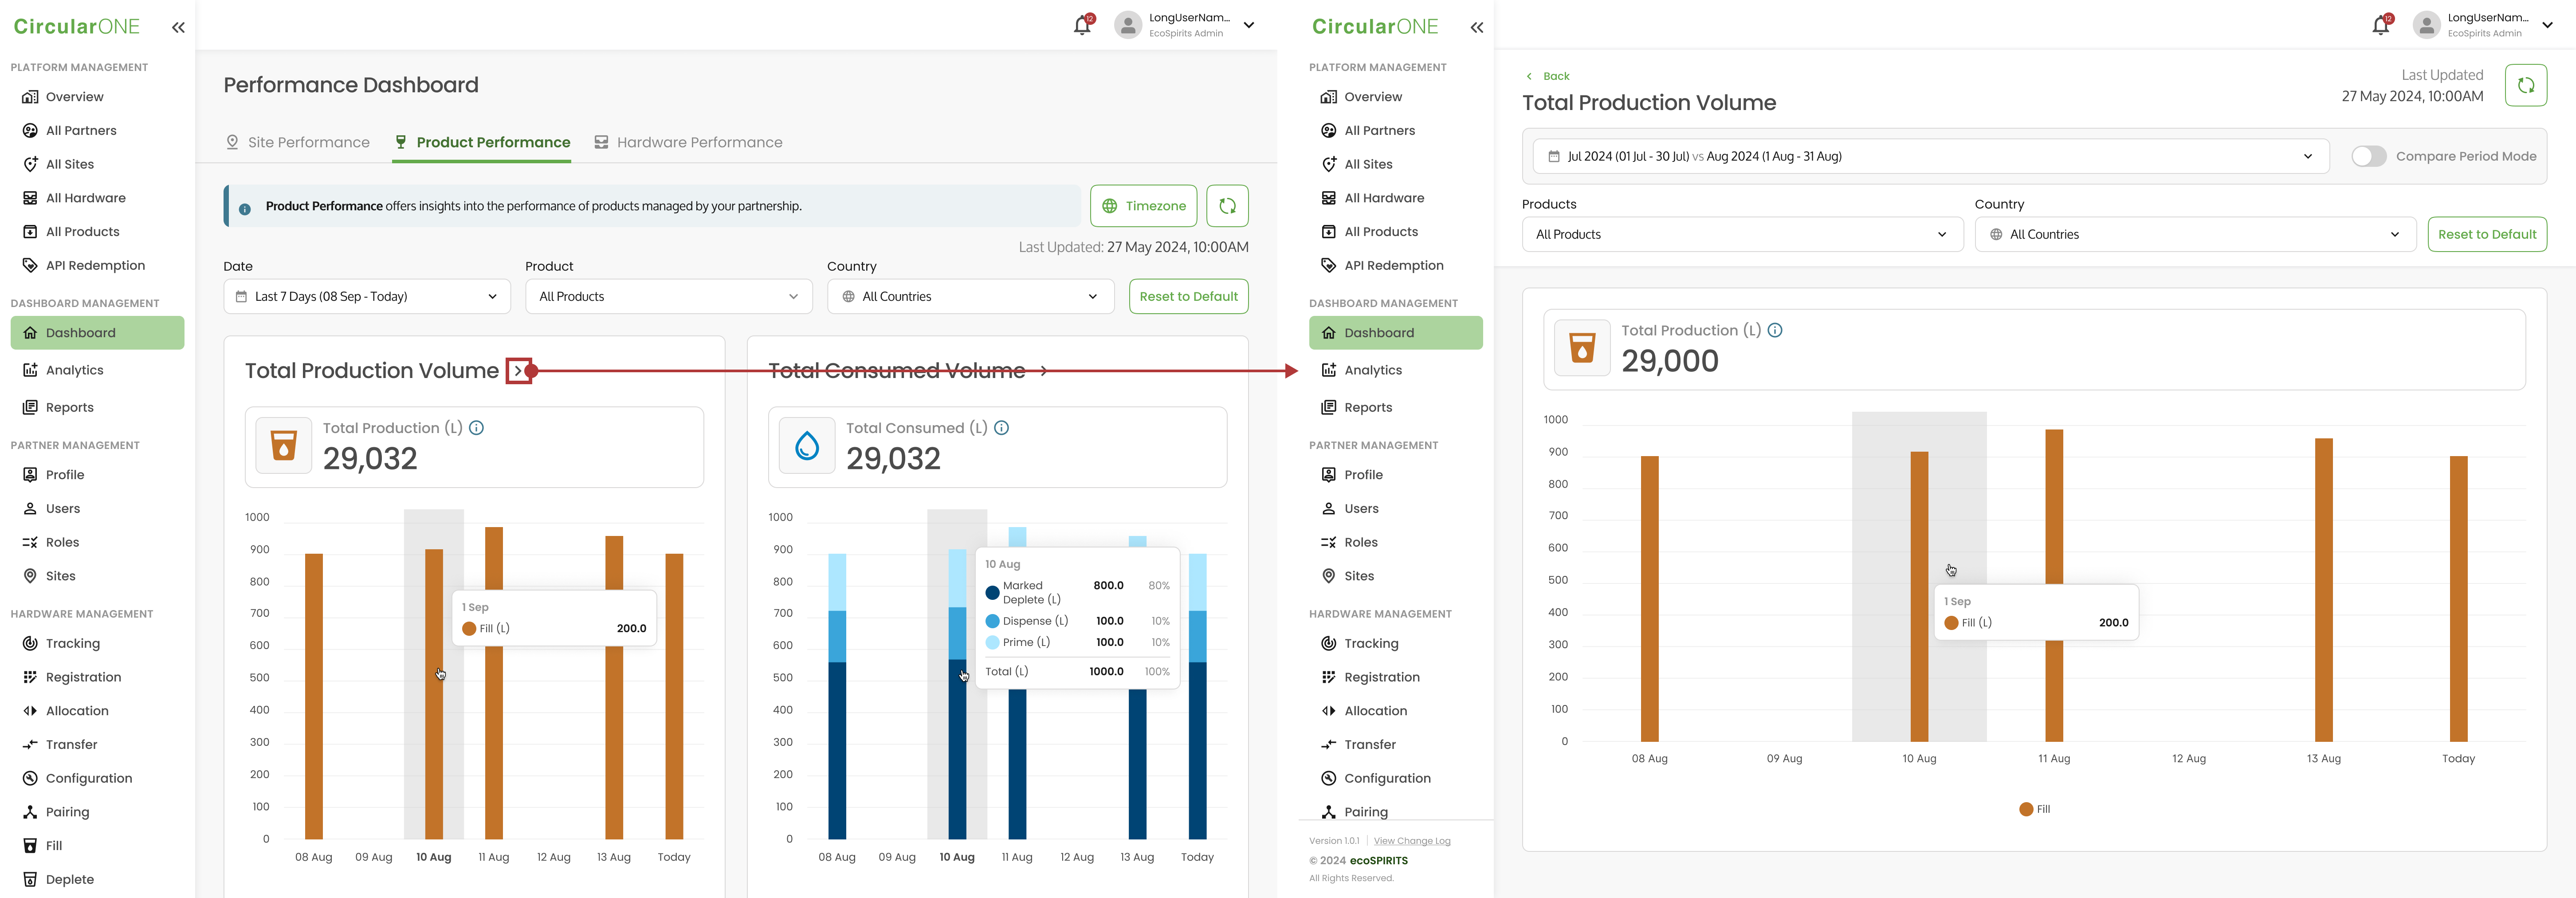
2 | Access the detailed dashboard by clicking the ‘>’ next to the data header | |
| ||
3 | Toggle on the compare button to compare between periods | |
| ||
4 | At any point of time if you would like to reset the filters, you can click ‘Reset to Default’ | |
| ||

No comments to display
No comments to display